
| Version 1 (modified by , 20 years ago) ( diff ) |
|---|
Orbit > Planetlab-ORBIT Integrated demo
Planetlab-ORBIT integrated demo
Revision History
| Version | Date | Revised by | Changes |
| v0.1 | 2006-06-04 | Sachin Ganu | Initial version |
Objective
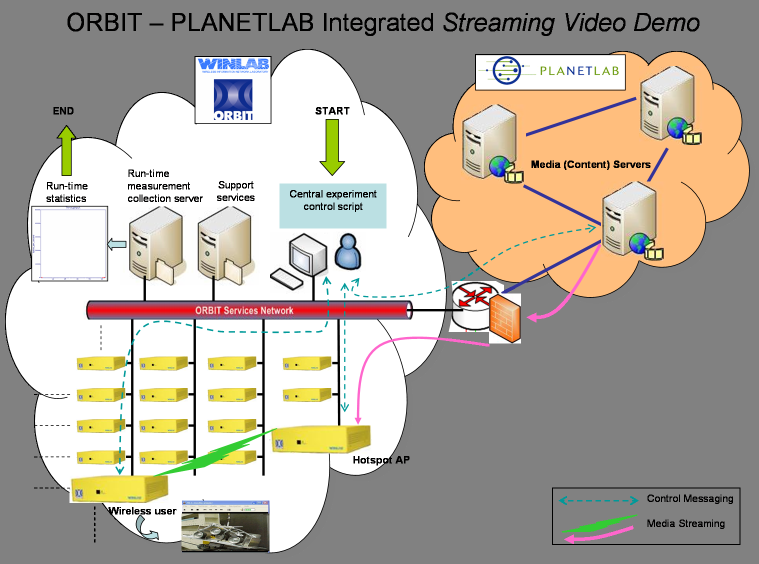
The objective of this demo is to show the federation of the two heterogeneous testbeds: Planetlab and ORBIT. This demonstration illustrates a typical wireless hotspot scenario with one node in the ORBIT testbed fetching video media off a remote Planetlab node and serving it to a fixed and mobile client.
The demo has been choreographed to use nodes 17-2 and 17-7, where 17-2 is the hotspot AP that fetches the media content off a remote Planetlab node pli2.pa-1.hpl.hp.com and serves it to node17-7 as well as the robot based mobile node.
Bitrate (in kbps) is measured by the receiving node and reported to the ORBIT infrastructure using the OML library.
A representative picture of the scenario is shown below [[Image
Timeline     SOURCES                                                  DESTINATION
                                         1.5Mbps UDP CBR on Wireless
Time 0       Group 1: [1,2],[1,4],[1,8] -------------------------------> [5,4]
Time 10      Group 2: [2,1],[2,3],[2,5] -------------------------------> [5,4]
...

Time 60      Group 7: [8,1],[8,5],[8,7] -------------------------------> [5,4]

Time 110     Stop Group 1 senders.
Time 115     Stop Group 2 senders.
...
Time 140     Stop Group 7 senders.
Steps to Execute Demo
- Image name — conf-room-demo.ndz. Resides on repository2:/export/orbit/image.
- Log onto console.sb9.orbit-lab.org using ssh (see HowToGetStarted).
- Turn off all nodes using the following command:
wget -O - 'http://cmc:5012/allOff'
- Execute the following command on console.sb9.
imageNodes atheros conf-room-demo.ndz
- nodeHandler scripts — execute following command on console.sb9
nodehandler -k test:exp:conf-room-demo
- Display machine
On the display machine, point your Internet Explorer or Mozilla Firefox browser to http://sb9.orbit-lab.org. What you expect to see is a page with three frames - one showing the topology of the smaller grid, one showing a control interface to change the packet size and offered load and the third with a link to plot the cumulative throughput at the access point (AP).
The frame showing the topology should initially display 64 yellow boxes representing the nodes on the grid. Once the nodes in the experiment turn ON, the corresponding yellow boxes will turn green. Once the sending and receiving applications start, the senders will turn blue and the receiver will turn red.
Click the link for the cumulative throughput in the third frame — the expected behavior for the curve is that initially, the throughput will rise as senders are added but beyond a certain number of senders, throughput will fall drastically. The explanation for this drop is that
- the current implementation of CSMA/CA fails to prevent losses from occurring in a congested environment
- the 802.11 bit-rate adaptation algorithm, which believes CSMA/CA to be perfect, infers these losses to be due to poor channel (SNR) conditions and drops the bit-rate accordingly. This in turn makes the situation worse given that the same frame will now take a much longer time on the medium — all senders will drop their rate to 6Mbps and the cumulative throughput will reflect this (it should be equal to the saturation throughput at 6Mbps).
Troubleshooting
- The graphics displaying the topology uses SVG - this is built into the latest Mozilla firefox but you will need an SVG viewer extension for Internet Explorer. This extension can be downloaded from http://www.adobe.com/svg/viewer/install/main.html.
Attachments (4)
- planetlab-orbit.png (1.2 MB ) - added by 20 years ago.
- nodehandler-planetlabdemo.tar.gz (1.7 MB ) - added by 20 years ago.
-
Source_code.rar
(1.3 KB
) - added by 20 years ago.
Source codes for the demo
-
Proto&app.rar
(1.3 KB
) - added by 20 years ago.
Prototypes and Application defination