
| Version 5 (modified by , 21 years ago) ( diff ) |
|---|
Orbit > Tutorial > Analyzing Measurement Results
Analyzing Results
It is important to understand how measurements were collected and organized to be able to interpret them. The ORBIT Measurement Framework provides tools to insert points to tap available information and to effectively collect that information in a timely manner. And after the experiment is done, the user would get access to the exprimenet database generated. In general, the results of the experiment is in one MySQL database. Different participating nodes populate different tables of this database. Usually, user would like to post-process or visualize those raw measurements for further analysis.
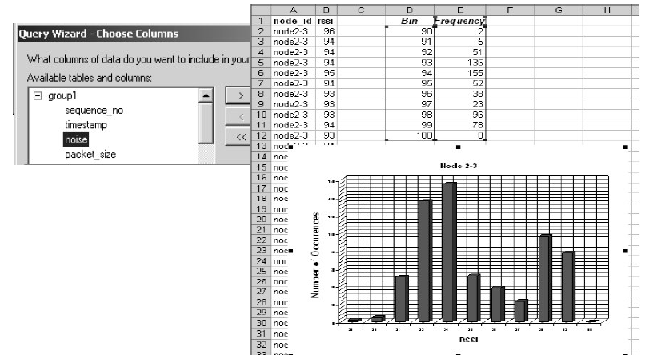
A number of different tools are available to interpret experimental results. The choice of tools depends upon availability and the nature of the measurements. Microsoft Excel can be used to analyze an experiment as shown below.

The user could import MySQL database to Microsoft Excel and use chart and other tools to analyze the measurements.
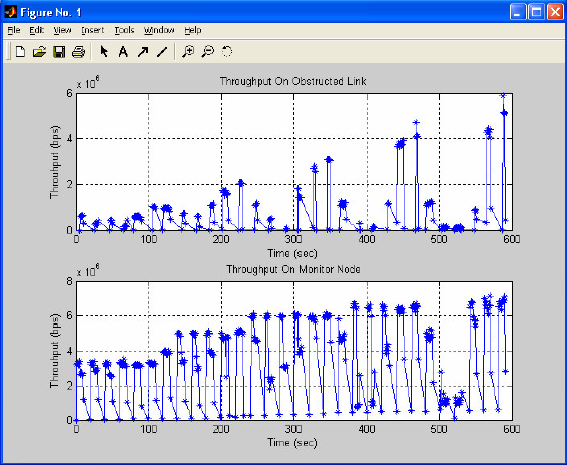
Matlab is another tool can be used. Sample Matlab code is shown below
function nsf(dbServer, dbUser, dbPW, database);
% Part where we retrieve data from the database;
mysql('open',dbServer, dbUser, dbPW);
mysql('use', database);
output = struct('time',[],'thr_all',[],'node',[]);
[output.time, output.thr_all, output.node] = mysql('select timestamp, throughput, node_id from group2');
[thru1_4, time1_4, thru3_1, time3_1] = sort_mysql(output);
% Finally, the plotting part
subplot(2,1,1);
plot(time1_4, thru1_4, '-*');
title('Throughput On Obstructed Link');
xlabel('Time (sec)'); ylabel('Throuhput (bps)'); grid on;
subplot(2,1,2);
plot(time3_1, thru3_1, '-*');
title('Throughput On Monitor Node'); xlabel('Time (sec)');
ylabel('Throuhput (bps)'); grid on;
And the resulting graph is show below:

Attachments (5)
- Excelexample.PNG (94.2 KB ) - added by 21 years ago.
- Matlabexample.PNG (143.6 KB ) - added by 21 years ago.
- ResultServiceVBA.xlsm (39.9 KB ) - added by 12 years ago.
- ResultServiceVBA_Sheet1.png (99.1 KB ) - added by 12 years ago.
- ResultServiceVBA_IperfTransfer.png (110.4 KB ) - added by 12 years ago.
Download all attachments as: .zip